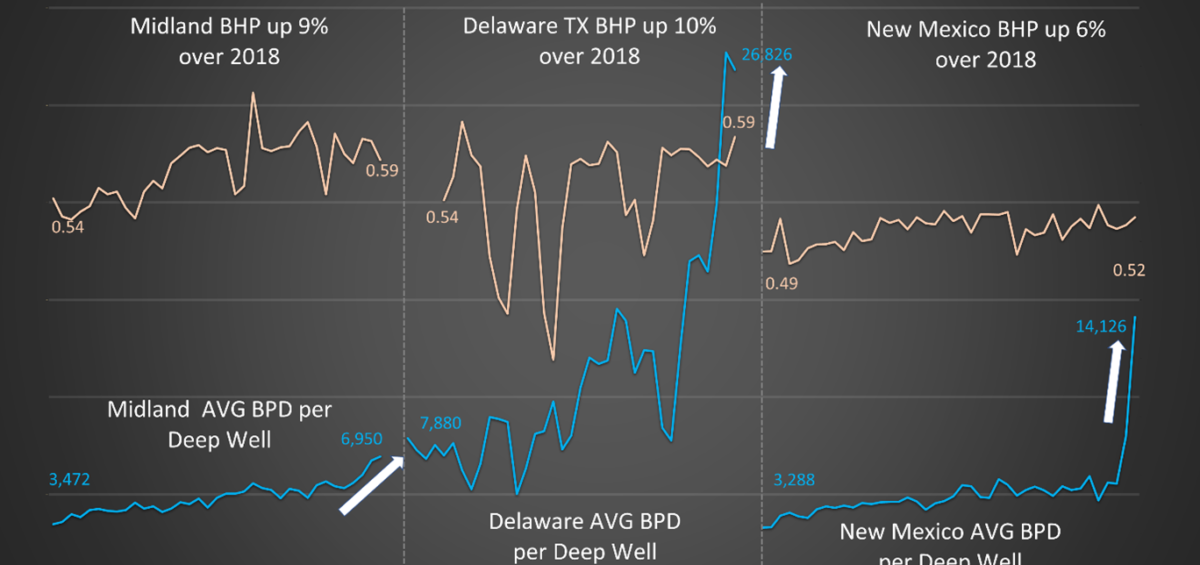
As part of our series on Permian SWD water management, we thought we’d share a historical visual of Bottomhole Pressures in the Permian versus Injection volumes, for each of the major sub-basins:
- Midland, TX
- Delaware, TX
- SE New Mexico
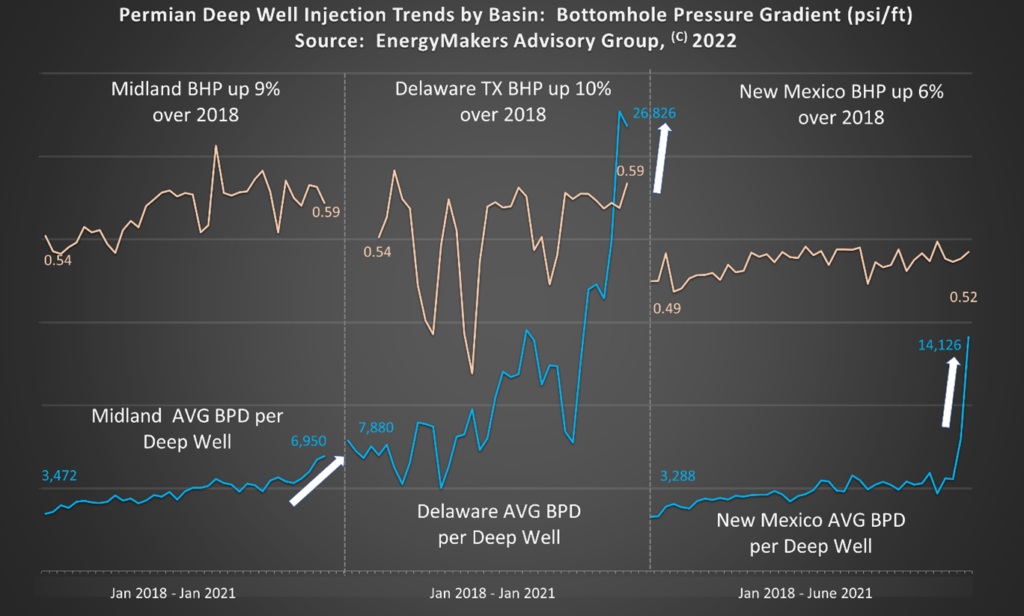
As you can see, over the 2018-2021 (January) time frame bottomhole pressures, shown as pressure gradients (psi/ft) to normalize for comparison, grew over 9% in Midland and 10% in the Delaware Texas, and a more modest 6% in New Mexico, over a slightly longer time frame.
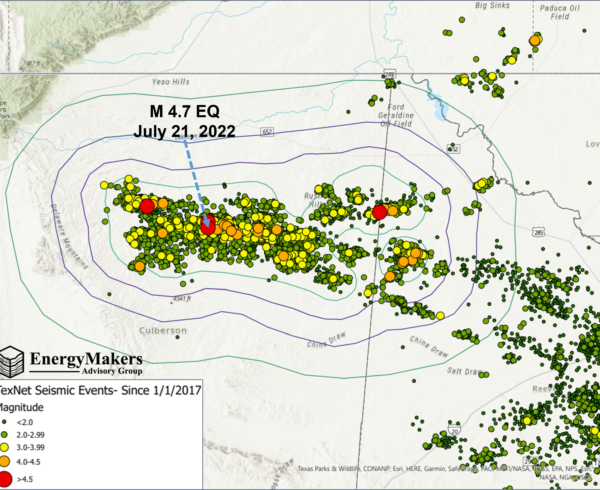
But note…the modest pressurization increases accompanied modest injection increases, until we started coming out of COVID in late 2020. Notice the surge in volumes in late 2020 and early 2021. Given pressurization trends and regional seismicity upticks, we recommend proceeding cautiously with new deep well placements.
Stay tuned for future updates on how the regions’ bottomhole pressures are responding to the escalating injection volumes.
Also, in our next blog, we’ll aim to include EOR pressure responses, as well. You can start placing your predictive bets now!


