We’ve been asked to opine on the future implications of the Seismic Response Area (SRA) recently identified by the Texas RRC. The area is located in the heart of the Midland basin, at the intersection of Andrews, Martin, Ector, and Midland counties. The intent behind the RRC’s “voluntary” curtailment requested of operators is to abate induced seismicity believed to be caused by disposal injection in the area. We investigate spatial relationships between injection and seismicity and seismic trends across the Permian. In upcoming blogs, we then evaluate:
· Implications to operations relying on shallow SWDs in the area,
· Deep SWDs in the area, and generally,
· To the industry as a whole.
All analysis was based on best available data from the RRC as of June 2021.
Seismic Trends in the Permian:
While seismic restrictions exist throughout the Permian for Salt Water Disposal (SWD) wells operating within 9.01 km, or 5.6 miles from an earthquake, we remind readers that there is very little published, peer-reviewed research which ties central Delaware-area seismicity specifically to SWD injection. While there is rampant speculation, and certainly injection has been tied to seismicity in many other basins, there exists a massive void on causation research in the Permian. The complexity is compounded because in most regions injection wells are located in the same regions as productive wells and newly fractured wells; plausibly, each may play a contributing role in the overall pressure and flow regimes which contribute to seismicity.
The image below shows how seismic activity has migrated since 2018 according to TexNet.
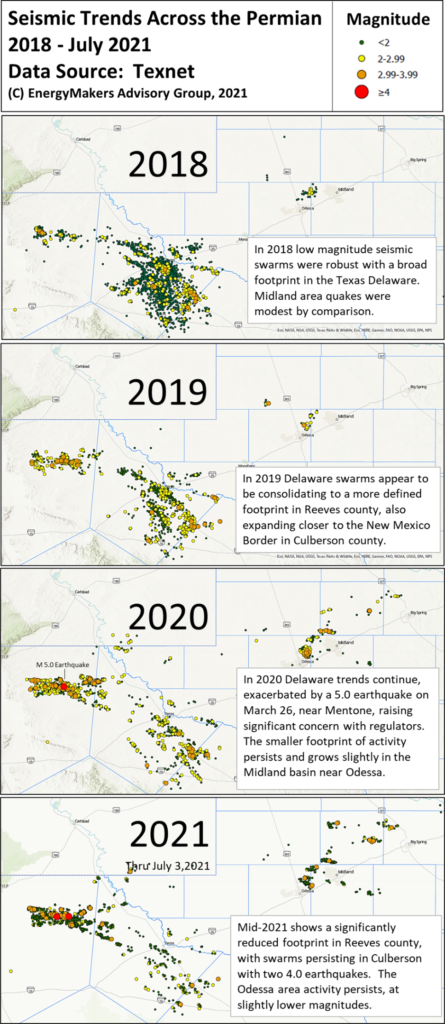
Interestingly, in Reeves County (home to the dominant regional swarm in 2018), earthquakes have waned and by quite a bit. In fact, during 2019 when SWD injection volumes surged in Reeves county, the earthquake counts went down. While it’s hard to tell if injection waned substantially in 2020 (disposal reports are generally 15 months in arrears), Delaware seismic activity appears to have waned and consolidated in linear trends within Reeves county. Were SWD injection causing seismicity, we would assume it would persist and not decline.
Culberson County is a very different story, but Culberson volumes have grown multifold, driven by produced water coming from New Mexico. We estimate over 95% percent of the water in Culberson is coming from across the border, much injected into higher rate deep wells. Strong deep linear seismic trends persist in Culberson, as injected volumes continue to mount. In Culberson, there is comparably little production activity.
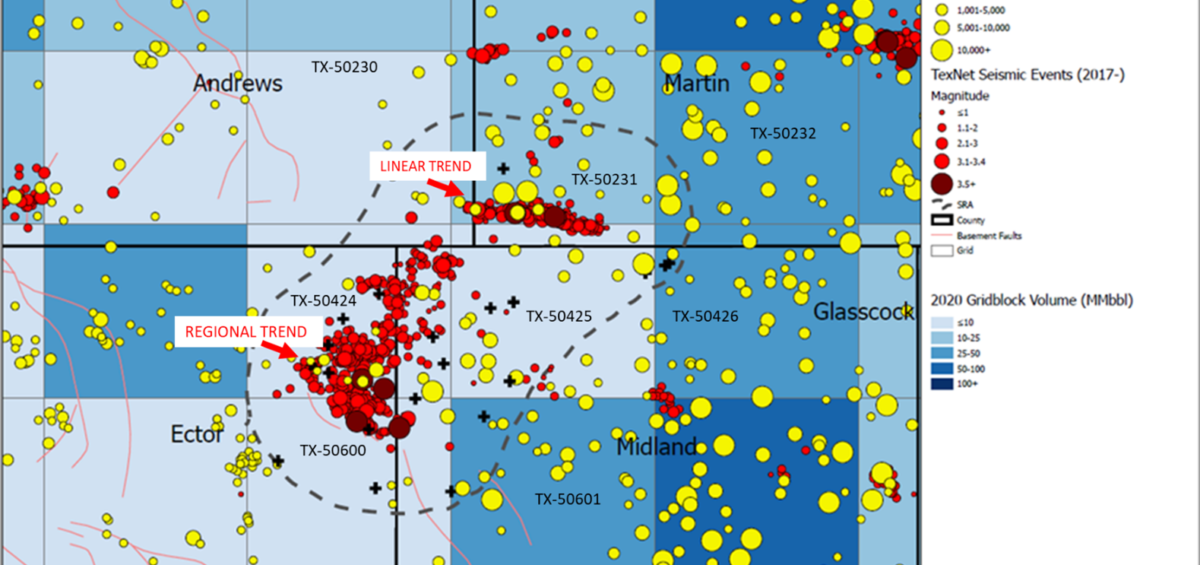
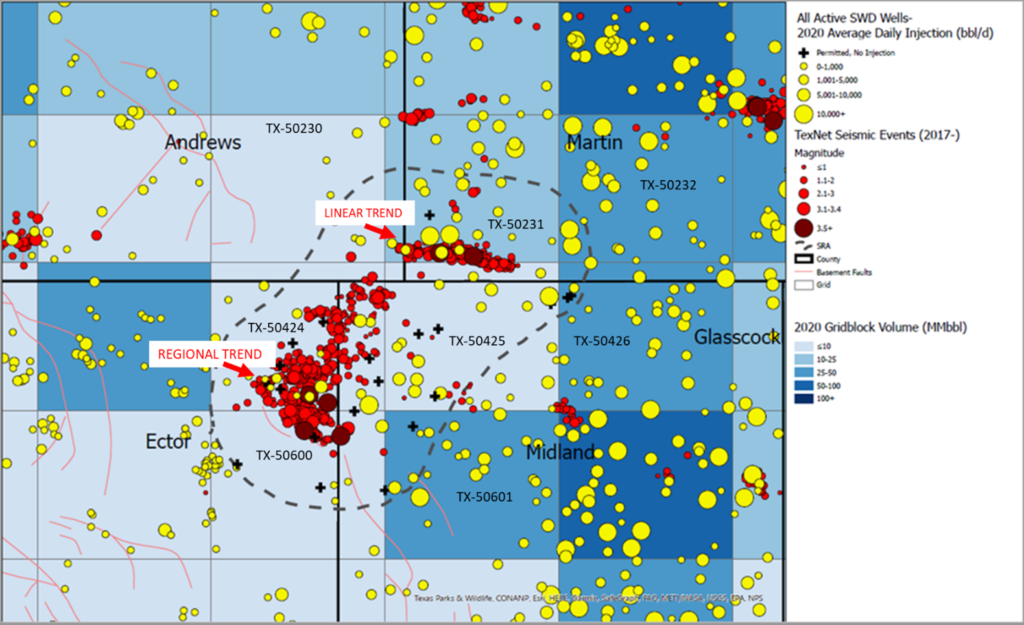
The expansion into the Midland basin is readily observed in the maps above. Consider the two maps below for correlations with oilfield activity in the SRA. In the first map, the Seismic Response Area is bounded by the black dotted line. The highest rates of daily injection are shown in the darker blue cells (each a 10 x 10 mile gridblock). The lightest blocks are the lowest injection levels for 2020. Daily injection volumes/well are shown by the size of yellow circle. Note that the seismic activity (red dots) is not located in the areas of concentrated disposal and high injection rates, and rather, the earthquakes presented in areas where the disposal rates are lowest (light blue squares). Note the broader “regional” swarm of earthquakes versus the more “linear” trend of earthquakes. There appears to be little obvious correlation to the rate of injection and seismic injection, within the SRA. Spatial correlations exist within the linear trend, which is close to some higher rate SWDs, but less so with the broader regional trend, which is well-away from most disposal wells and areas of high injection concentration.
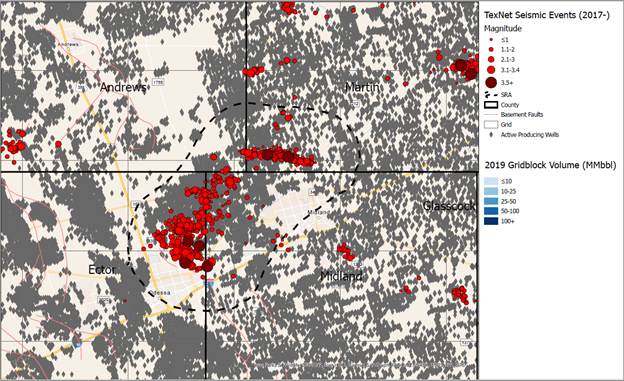
The second map shows correlation with production/extraction. Keep in mind that along with the produced oil, produced water (ultimately going to SWD) is extracted, along with produced water (ultimately going to EOR). There is some overlap between earthquake locations and productive areas. As with activity in the Delaware basin, the areas of seismicity appear to be south of, or downstream, or towards the coast relative to concentrated productive areas.
The cutaway view below allows a visual correlation between oilfield activities, volumes, and depth ranges, simplified for clarity. The column labels match the gridblocks in the first map. All figures are shown as TVD below surface, based on the top of the intervals.
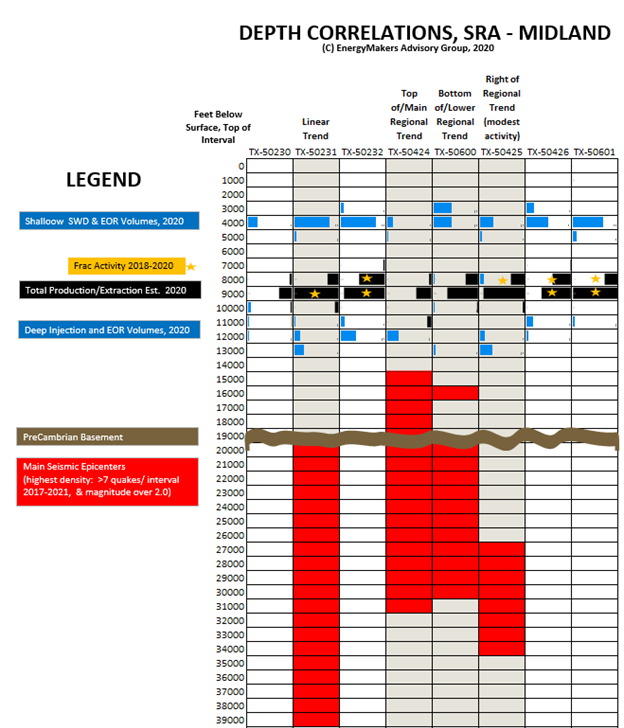
The linear trend, dominant in TX-50231, is overlain by 2020 deep injection volumes of 7.8 M barrels, starting some 7,000 feet from the top of seismicity. Above this, substantial hydraulic fracturing occurred, and 10,000 feet from the top of seismicity, some 29 M barrels of oil and water were extracted during production.
Note immediately adjacent to the area (TX 50232) deep injection volumes were higher (8.7 M barrels in 2020), production volumes were high, and there was more hydraulic fracturing, yet no earthquakes occurred.
In the Regional Trend, a total of 27 M bbls of deep well injection occurred some 7,000-8,000 feet above the Pre-Cambrian basement, along with a total of 95 M bbls of extracted oil and water some 3,000 feet away, centered around 11,000 feet above the Pre-Cambrian. Relatively speaking, there was not as much hydraulic fracturing in this region, (although even modest hydraulic fracturing activity has been shown, in some regions, to cause earthquakes).
In both cases, the produced/extracted (oil and produced water) volumes were about 3X the deep injection volumes, although substantial volumes of fluids were injected in shallower zones, albeit much further away.
In the absence of additional data, it is difficult to draw strong correlations between any single oilfield activity and seismic response(s). (We did not have access to hydraulic fracturing schedules to investigate correlations with hydraulic fracturing activity.)
Too, we completed a thorough review of all the available SWD injectors in the area. All of the wells were behaving as expected for the region, based on RRC data as of June of this year. None had experienced dramatic volumetric surges, and none demonstrated remarkable pressures or pressurization trends. All the wells were well-within compliance levels set for volumes and pressures.
In summary, we failed to find a smoking gun clearly tying SRA earthquakes to area SWD injection in general, or deep SWD injection specifically, although deep SWD is more proximal to the pre-Cambrian basement.Pressure disparity is clearly occurring between strata, with production / extraction lowering formation pressures (@ 3X the volumes of deep SWD), and deep SWD driving higher formation pressures, albeit at lower relative volumes.
Tomorrow, we’ll discuss the business and financial implications for deep and shallow well operators in the SRA region.


